VictoriaMetrics
VictoriaMetrics is a fast, cost-effective, and scalable time series database. It can be used as a long-term remote storage for Prometheus.
It is recommended to use the single-node version instead of the cluster version for ingestion rates lower than a million data points per second. The single-node version scales perfectly with the number of CPU cores, RAM, and available storage space.
Prominent features
- Supports all the features of the single-node version.
- Performance and capacity scale horizontally.
- Supports multiple independent namespaces for time series data (aka multi-tenancy).
- Supports replication.
Architecture overview
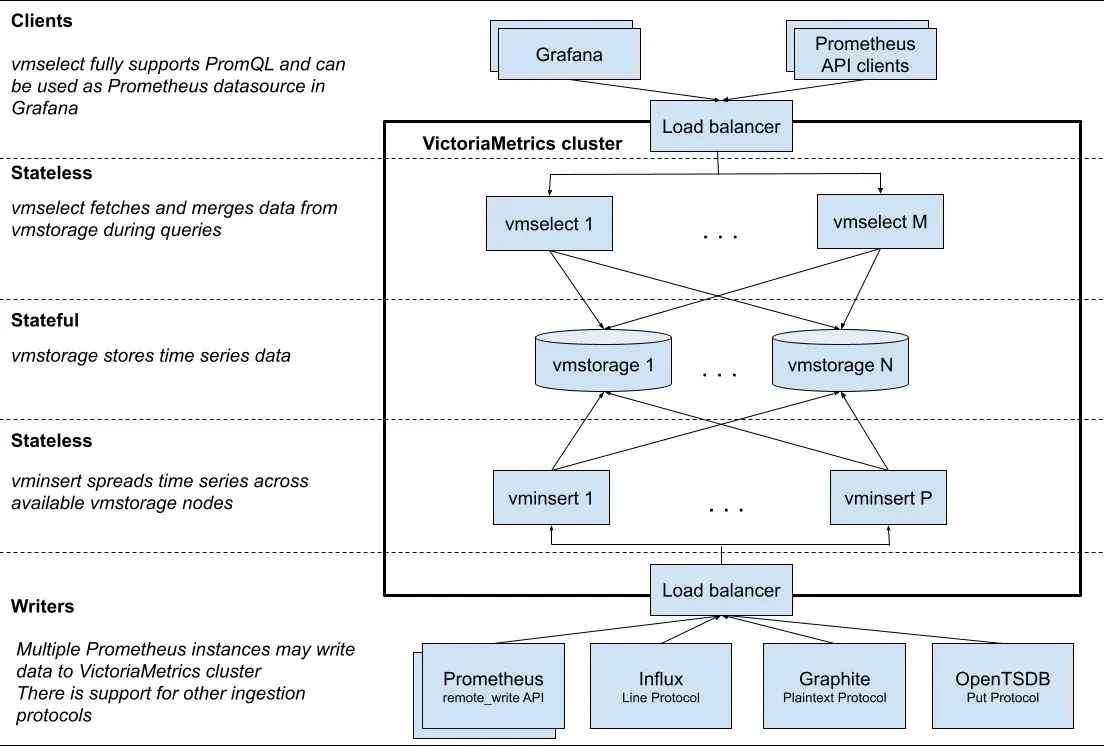
The VictoriaMetrics cluster consists of several services.
Each service may scale independently and may run on the most suitable hardware.
vmstorage nodes do not know about each other, do not communicate with each other and do not share any data.
This is a shared nothing architecture. It increases cluster availability, and simplifies cluster maintenance as well as cluster scaling.
The VictoriaMetrics cluster consists of the following services:
vmstorage
vmstorage stores the raw data and returns the queried data on the given time range for the given label filters.
This is the only stateful component in the cluster.
vminsert
vminsert accepts the ingested data and spreads it among vmstorage nodes according to consistent hashing over metric name and all its labels.
vmselect
vmselect performs incoming queries by fetching the needed data from all the configured vmstoragenodes.
To access the vmselect GUI, use SSH port-forwarding.
-
(
ncn-mw#) Get the port number of thevmselect-vmsservice.kubectl get service -n sysmgmt-health vmselect-vmsExpected output looks similar to the following:
NAME TYPE CLUSTER-IP EXTERNAL-IP PORT(S) AGE vmselect-vms ClusterIP None <none> 8481/TCP 122d -
(
ncn-mw#) Enable Kubernetes port forwarding, using thevmselect-vmsservice name and the port number from the previous step.kubectl port-forward -n sysmgmt-health service/vmselect-vms 8481:8481 -
Use a local laptop or desktop command line to access the cluster.
Replace
SYSTEM-IPwith the IP address of the NCN used for the previous step.ssh -L 8481:localhost:8481 root@SYSTEM-IP -
Open
http://localhost:8481/select/0/prometheus/vmui/in the browser to access the GUI.
vmagent
vmagent is a tiny but powerful agent which helps collect metrics from various sources and stores them in VictoriaMetrics
(or any other Prometheus-compatible storage systems that support the remote_write protocol).
To access the vmagent GUI, use SSH port-forwarding.
-
(
ncn-mw#) Get the IP address and port number of thevmagent-vmsservice.kubectl get svc -n sysmgmt-health vmagent-vmsExpected output looks similar to the following:
NAME TYPE CLUSTER-IP EXTERNAL-IP PORT(S) AGE vmagent-vms ClusterIP 10.17.40.41 <none> 8429/TCP 6d5h -
Enable SSH port forwarding, using the IP address and port number from the previous step.
Replace
SYSTEM-IPwith the IP address of a master or worker NCN.ssh root@SYSTEM-IP -L 8429:10.17.40.41:8429 -
Open
localhost:8429in the browser to access the GUI.
vmalert
vmalert executes a list of the given alerting or recording rules against configured data sources.
When sending alerting notifications, vmalert relies on configured Alertmanager.
Recording rules results are persisted via remote write protocol.
vmalert is heavily inspired by Prometheus implementation and aims to be compatible with its syntax.
Cluster resizing and scalability
Cluster performance and capacity can be scaled up in two ways:
- Vertical scalability: Adding more resources (CPU, RAM, disk IO, disk space, and so on).
- Horizontal scalability: Adding more of each component to the cluster.